Costing systems: from outdated to functional and reliable
DECIMAL Expert
Is your costing system outdated? Does it adhere to best practices? What signs are there to indicate that your costing system is generating results that are approximate at best?
Read on for the attributes of a truly outdated costing system, then check out the features of a truly effective model.
Attributes of an outdated costing system:
- You have trouble justifying your profit margins;
- Your managers want to abandon certain products/services;
- The prices for your complex products undercut those of the competition;
- Your competitors’ / subcontractors’ prices are significantly lower than yours;
- Your organizations has many different costing systems;
- You are the only company that provides a given product/service;
- You clients do not complain about price increases;
- You spend a lot of time analyzing your costs;
- You are not sure what price you should quote in order to make a reasonable profit;
- Your managers are skeptical about the cost of operations.
While you may not have noticed any of these signs within your organization, this does not mean that your costing system is performing as it should. See how your system matches up against the following description of an effective costing system.
What makes an effective model?
To be truly effective, a costing system must unfailingly base its calculations on: 1) cause-effect relationships; and 2) their behaviour. In fact, the ability to assign attributes to certain model zones enables users to view their overall costs from different angles.
CAUSE-EFFECT RELATIONSHIPS
We will illustrate the above statement with an example. Let’s take a typical human resources department. Most systems will allocate that department’s costs based on the number of employees, or pro-rate them based on product costs (the equivalent of a X% “tax” applied to costs), but these methods are not effective as they are not based on a cause-effect relationship. In our case, because we are in a major expansion phase, we are focussing our efforts on hiring new employees. So, we need to look at how we allocate recruiting activities.
First of all, since the hiring process for VPs is more complex than it is for office staff, we may decide to ask an executive recruiting agency to contact candidates, administer psychometric tests and propose a short list of potential VPs. This proves that hiring a VP requires more money and effort from the HR department than hiring an office clerk.
Secondly, the turn-over rate (% per employee) may be higher in some parts of the organization than in others. Rather than allocating recruitment costs based on the number of employees (cause-effect relationship), we chose to allocate them based on the time it takes the HR department to hire new staff. In other words, the cost of specialized recruiting services should be transferred to the administrative unit that benefits from those services.
COST BEHAVIOUR
The cost model should be built in such a way that costs are allocated to different elements – products, costs, etc. – depending on the cost behaviour. The following table illustrates the meaning of the term “cost behaviour”:
| Cost Behaviour | Cost Types | Explanation |
| Unit-level activities |
|
Occur every time a product is made or sold |
| Batch-level activities |
|
Occur every time a batch of units is handled or produced |
Product and service-level activities |
|
Occur because of specific product lines |
| Customer support activities |
|
Occur because of clients |
| Facility support activities |
|
Occur to support the entire process |
There are many advantages to building the cost model based on cost behaviour. For example, suppose you have an extremely demanding client who has specific shipping needs or a high volume of customer support calls. Although that customer may be profitable strictly in terms of products and/or services, he or she may become unprofitable if we factor in customer support costs. With this information at its disposal, the company can take whatever actions are required to make the customer profitable. However, if the company had combined its customer support costs with its product costs, it would not have had the necessary information to turn an unprofitable customer into a profitable one.
ATTRIBUTES
Assigning attributes to modelled costs means managers can view their costs from different angles and determine ways to improve them. For instance, you could choose the following features and activities to qualify the activities and processes in your value chain:
| Area of analysis | Attribute |
| Value |
|
| Potential for improvement |
|
| Quality control |
|
Advantages of an effective costing system
There are obviously many advantages to an effective costing system. For instance, you can use it to:
– Understand your cost mix
- If shared services centres, such as IT departments, understood their cost behaviour they could plan their costs better and produce better budgets Improved understanding of process and activity costs reinforces optimization initiatives
- Specifically, it helps managers identify areas that would benefit from performance improvement projects, such as Lean Management or Process Re-engineering. This improved understanding could also be useful for conducting comparative studies (Benchmarking).
– Set rates
- Whether you are selling to external clients or operating in a shared services-type environment, make sure your rates are in line with your costs.
– Analyze your profitability
- This enables you to identify your unprofitable clients, products and distribution channels, and use this information to devise appropriate strategies. For example, you could make these clients more profitable by using one of the following margin management techniques:
- Apply a surcharge or adjust costs based on the additional expenses incurred to serve that client
- Suggest various service level options to the client that are still profitable for you
- Change that client’s product-margin mix by, for instance, grouping products or services
- Negotiate terms that would positively impact cost structure, such as producing a bi-monthly instead of a weekly report
- Cut back on services and/or raise prices
- Improve processes
- Abandon certain products, services or clients.
– Create and revise scenarios
- This exercise enables you to predict the costs, profitability and resources (capacity) required to implement organizational changes, changes to resource costs and/or to the volume (quantity) of goods and/or services.
– Ensure sound governance and accountability
- Provides the organization with a common language
- Ensures decisions – resource allocation, value chain, outputs, clients served – and their impact on costs and profitability are better understood.
What are the main costing features of the Decimal Suite?
FLEXIBLE
The Decimal Suite is a robust, highly flexible cost-modeling tool, regardless of the method you use (with allocations, activity-based costing, time-driven ABC, activity-based planning, etc.). The system can support an unlimited number of cost objects and cross-allocations, and is as well-suited to SMEs as it is to large companies or multinationals, in any business sector. Because it can be accessed online, geographically dispersed users can work simultaneously on the same cost model.
USER-FRIENDLY
Standardized interface – To facilitate navigation, the Decimal Suite interface is standard across all applications, for costing, budgeting and payroll planning. If you are in budgeting and need to switch to costing (or vice versa), you will instantly feel familiar with the module’s interface and be able to navigate through its menus with ease.
Personalizable interface – You can personalize the interface by moving or hiding columns, displaying menus in French or English and changing the screen font size.
Original screen

Personalized screen – We have increased the font size, hidden the Type of Activity column, inverted the No Activity and Description columns and changed the width of certain columns.

Copy/cut and paste – You can easily copy/cut and paste information from an application such as Excel, Word or Outlook, etc. to the Decimal Suite, and vice versa.

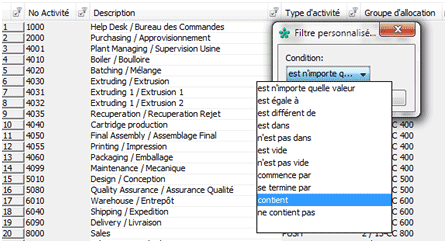
Finding information – You can perform searches within columns and apply complex filters; the totals are automatically recalculated when the filters are applied or removed.

Importing / exporting data – You can import and export any data you want to and from the Decimal Suite. A powerful import / export tool reads the file content in your operational systems and enables users to:
- choose a sub-set of data in the file. For example, it might only consider data from a specific cost centre, ignore transactions prior to a certain date, ignore amounts higher than the value of X, and so on;
- transform data from source files before importing it. For example, it could change text from uppercase to lowercase, or remove the commas from numbers in the following format: xxx,xxx,xxx.xx; at a predetermined time (daily, weekly, etc.), automatically read the data in your operational systems and import it into the Decimal Suite.
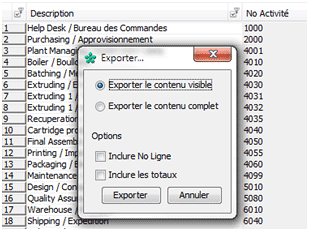
Of course, in many cases, users can also simply copy/cut – paste the entry screens. They can also quickly and easily export full screen content (including hidden columns) as well as only visible screen content (excluding hidden columns).
You can also create an ODBC link between software applications, such as Excel or PowerPoint, and a database. The software data in Excel, Powerpoint, etc. will be automatically updated when there is a change in the identified database.

Eliminates the need to re-enter data – There is no need to re-enter data if you are working in the budgeting and costing modules. When you import your Chart of Accounts into the Decimal Suite, that data is immediately available to all the budget and costing features.
Ad hoc reports and analysis – You can use the Pivot Tables right in the Decimal Suite to create ad hoc reports and analyses. These Pivot Tables have similar features to the ones in Excel: for example, you can apply filters and sort the table columns just like you can in Excel, and create different types of sub-totals, (sum, average, etc.). Also, you can save the report or analysis layout so you can quickly and easily redisplay the report or analysis at a later date.
Strategic Cost Management brochure

